Scope of homelessness in King County
One Night Count / Point-in-Time Census
The Seattle/King County Coalition on Homelessness conducts an annual “One Night Count,” which includes a street count in portions of Seattle, Bellevue, Kirkland, Redmond, Shoreline, Kenmore, Bothell, Woodinville, Kent, Federal Way, Renton, Auburn, and White Center and a survey of homeless shelters and transitional programs throughout King County. The 2012 “One Night Count” identified the following trends.
- Number of homeless individuals in King County for 2012
8,830 individuals were counted on the January 27, 2012 One Night Count homeless street count and survey data.
- Of these individuals, 6,236 people were found in shelters and transitional programs.
- 2,594 people were surviving outside without shelter.
- There are more homeless individuals or families throughout Seattle and King County who were not counted on the night of the count either because they were hidden from volunteer counters, are living unsheltered in areas of the county not included in the count, or are temporarily homeless but staying with friends and family.
- Household composition
Homelessness affects all segments of the population including children. The One Night Count survey coordinates data through Safe Harbors, their local HMIS system, and reports the following breakdown among households living in emergency shelter and transitional housing programs:
- 50% families with children
- 34% single adult men
- 15% single adult women
- Less than 1% unaccompanied youth
- Children and families
The King County Family Homelessness Initiative is working with providers and funders to make important shifts in the way they collaborate and serve homeless families with a more streamlined, accessible system that will prevent families from becoming homeless; quickly rehouse those who are homeless; and link them to services they want and need to remain stable in their own housing. Family Housing Connection (FHC), their local coordinated entry and assessment system for homeless families, went live April 23, 2012. Highlights from the first six months of data on families accessing FHC include:
- Around a third are young parents (age 25 or under) and half of these are very young parents (18-21).
- About half of the children are not yet school age (under age 6).
- Persons of color are over-represented relative to the general population and those in poverty (64%).
- 70% are not currently employed.
- Most families (69%) are homeless for the first time.
- Most families (57%) are doubled-up (staying or living with a friend or family member).
- Fully 85% of families want employment and education services.
- Families are experiencing a housing and economic crisis; 93% have income below 30% of AMI.
- Most families have low housing barriers and many strengths including positive work history (53%), no evictions (67%) and low or no criminal history (86%).
- Youth and Young Adults
Programs serving youth and families conduct a point-in-time census geared towards youth and young adults, called Count Us In identified:
- 685 youth and young adults ages 13 to 25 who were homeless or unstably housed.
- Of these, 408 were staying in shelter or transitional housing programs.
- 277 youth and young adults were surveyed at program sites and other places that homeless youth frequent. Many of these youth ‘couch surf’ with friends and relatives and so represent a hidden aspect of homelessness.
- 81 were literally homeless
- 70 indicated they were at imminent risk of losing their housing
- 126 were unstably housed (didn’t know if they could stay in current situation 30 days from now)
- Most of these youth in shelters (67%) were in programs designed for youth under age 18
- Minors made up 21% of the of the overall total
- 55% were female
- 62% were people of color.
The youth and young adults counted by the survey differed from those in shelter or transitional housing. A higher percentage of survey youth were minors, male and African American, Asian or multiracial and from South Seattle or South King County.
- 685 youth and young adults ages 13 to 25 who were homeless or unstably housed.
- Single Adults
In 2012, a Single Adult Shelter Task Force was convened to explore how to increase access to permanent housing among shelter residents. The task force conducted analysis of multiple data points on the number and types of shelter beds, program models, demographics and types of people who access shelter. Highlights of this analysis include:
- Approximately 2,583 beds identified as part of an Inventory for single adults: Indoor, year-round shelter programs (1,829); Tent city/communities (299); Winter Season Shelter beds (455 seasonal)
- 92% of the indoor shelter beds are located in Seattle and 8% are outside Seattle
- 75% are overnight shelters only (clients come into shelter between 8-9 pm and exit between 6-8 am)
- Close to half of the year-round beds are in donated or leased space
- The number of shelter beds expands and contracts during the year, e.g. 450-700 more beds are available in the winter months (typically November-March), then they close
- Among those staying 8-59 days: Seattle client profile -- majority are men, 31-50 years old, people of color, disabled, and 21% are veterans. King County client profile -- majority are younger men, not disabled, and 11% are veterans.
- Among those staying 180+ days: Seattle client profile -- majority are men, 51 or older, disabled, 23% are veterans. King County client profile -- similar to above, although more are disabled and the number of older men increased somewhat.
General Demographic information from Safe Harbors HMIS on people accessing shelter indicate that shelter residents are predominantly male and a disproportionate number of people of color. More than one-third of clients stayed less than 7 days over a 12 month reporting period and there are differences in the populations served in Seattle and in the County. Important caveats: People may be homeless and not access services or access services not enrolled in Safe Harbors, and the demographics of shelter residents may be a reflection of the type of shelter programs available and who they attract.
- Racial Disproportionality
People of color are significantly over-represented in the homeless population. While people of color now comprise 35% of the general population in King County[v], nearly double that proportion (67%) of people living in emergency shelter and transitional housing are people of color. Regional Considerations and Affordable Housing
- Requests/Turnaways
- The Community Information Line/211 reports that nearly 50% of all calls received are housing related. Requests for utility assistance and food also increased. The largest number of calls comes from South King County, followed by Seattle.
- Cost of housing burden
- 45% of all renter households in King County pay more than 30% of their income for rent. Less than 5% of apartments in King County are affordable to households earning less than 30% of median income ($26,400 for a family of four).
- King County has a 4% vacancy rate, and the average rent for a two-bedroom apartment in King County is $1,069[vii]. A worker must earn over $20 per hour to afford this housing (housing is considered affordable when it costs 30% of one’s income).
- Costs of homelessness
- 1811 Eastlake, a program of the Downtown Emergency Service Center (DESC), provides supportive housing for 75 formerly homeless men and women living with chronic alcohol addiction. In the year after residency, residents reduced their visits to the emergency room, sobering center and jail, resulting in cost savings of more than $4 million.
- The 40 people who were the highest users of Harborview and the Sobering Center cost $2,000,000 annually until they got them into housing at 1811 Eastlake.
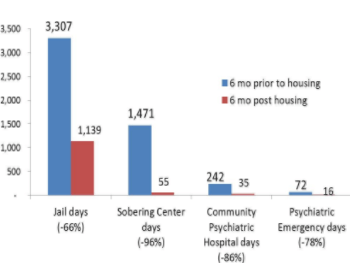
- Client Care Coordination (CCC) assesses and identifies individuals who are the most frequent users of emergency response services or who are highly vulnerable and currently on the streets. The goal is to enroll them in housing and reduce costly emergency services. Preliminary analysis completed in 2011 compared system usage six months prior to housing placement and six months post housing placement for 117 high utilizer tenants placed through CCC. Results showed significant reductions in the use of the jail, the sobering center, community psychiat¬ric hospitals and psychiatric emergency services, as shown in the adjacent chart.
- A mentally ill prisoner in the King County Jail (over half of whom are homeless) stays almost 140 days longer than a general population prisoner, at an estimated cost of $300 per night. In fact, the King County Jail is the second largest mental institution in the State of Washington.